

Inclusion to What End? The Parity Benchmark for Demographic Representation
Inclusion to What End? The Parity Benchmark for Demographic Representation
by Gregory Kearney and Joshua Rauh


The WEF is one of many organizations that have made diversity, equity, and inclusion (DEI) a fixture of their policy agenda. While diversity goals have historically taken many forms depending upon the specific organization, in recent years broader pushes related to diversity aim to manufacture equal representation outcomes across racial and gender categories. Proponents of such policies aim to rectify what they believe are systemic injustices brought on by historical circumstances.
When the demographic composition of firms or industries do not mirror that of the total population, supporters of DEI ascribe the difference to discrimination, either explicit or implicit. As the University of Washington’s DEI glossary puts it, “Diversity is the realization of difference and of inequity and understanding of power and privilege. It is balanced by inclusion, the desire to create equal opportunity and further, realize that a diverse community is stronger, richer and more sustainable than one which actively, or passively, excludes people who are different.”[1]
The WEF has gone so far as to claim that meeting more aggressive diversity targets has benefits that go beyond rectifying historical injustices, including boosts to performance and profit margins.[2] Broadly speaking, the WEF describes their objectives with respect to DEI as follows:
To design racially just workplaces, companies must confront racism at a systemic level — addressing everything from the structural and social mechanics of their own organizations to the role they play in the communities in which they operate and the economy at large. [This] Partnership [between the WEF and corporate leaders] has been designed to operationalize and coordinate commitments to eradicate racism in the workplace and set new global standards for racial equity in business. It also provides a platform for businesses to collectively advocate for inclusive policy change.[3]
For the purposes of this piece, we address these objectives by answering three questions: 1) Are “equitable” representation outcomes that mirror population demographics reasonable to expect in a workplace free of racism? 2) Is there evidence to support the idea that meeting more aggressive diversity goals improves firm performance and finally 3) Are there reasons to believe that this could potentially backfire?
1. Reassessing the Gender Parity Benchmark
Let us first consider when surveying various fields of work whether the reason for disparities across different fields can definitively be said to be due to widespread discriminatory practices.
First, consider academic fields in the U.S. While men are overrepresented in the field of economics, receiving 70 percent of all bachelor and doctorate degrees in that field,[4] 74 percent of psychology PhDs were awarded to women.[5] Looking at subcategories within psychology, cognitive psychology has a significantly lower disparity, only 54 to 46 percent in favor of women.[6],[7] While it is unclear what exactly are the admission dynamics and criteria that exist in psychology, it would be strange to find significantly more bias against men in one sub-field relative to another.
This is not only true within areas of academia. In sanitation work in the U.S. for example, only 17.9 percent of workers are women, while 82.1 percent are men.[8] The situation is roughly inverted in the distribution of teachers in the United States – 76 percent are female and24 percent are male.[9] The proportions of teachers have only moved slightly – by one percent – since 2000.
One may suspect that this is a United States problem – that in countries that are more homogeneous, egalitarian or that have greater civic trust there would be a higher degree of parity. Ironically, the opposite appears to be the case. Recent studies have suggested that countries with greater gender equality have worse outcomes with respect to parity within certain fields like economics, mathematics, and science that are often highlighted by media organizations as needing immediate rectification. A 2018 study in the journal Psychological Science found that countries with lower levels of gender equality like Albania and Algeria had higher percentages of women in STEM (i.e., science, technology, engineering, and mathematics) than countries like Finland, Norway and Sweden.[10]
Why might this be the case? The researchers note that countries with greater equality are generally richer. With reduced life-quality pressures relative to poorer and less equal countries, perhaps women in the richer and more equal countries are deciding to study and pursue whatever it is they want, as opposed to choosing fields based on striving to achieve the highest income.[11]
Yet explanations of this sort are not sufficient for the most ardent advocates of gender and race quotas. Despite supposedly opposing discrimination of any form, many of these advocates in corporate America will openly support explicitly discriminatory policies on the basis of identity. For example, former and prospective white and Asian applicants filed a class action lawsuit against Amazon just last year for only offering a $10,000 stipend for entrepreneurship to Black, Latino, and Native American candidates.[12] Microsoft and Google established caps on the numbers of white and Asian students that could be nominated for a prestigious PhD fellowship.[13] Banks have even begun incorporating race and gender quotas into loan agreements with firms, benefits which would provide lower interest rates to companies insofar as internal diversity targets are met.[14]
While DEI objectives related to racial and gender representation have trended up in recent years, expecting demographic parity across almost any professional domain is unreasonable, as numbers and types of people in different industries are radically different for all sorts of reasons and they rarely coincide with population proportions. Despite this reality, supporters of parity-at-all-costs policies have decided, ironically, to push even more deliberately discriminatory policies that aim to achieve these goals, ignoring the litany of variables that determine the ultimate industry-specific demographic dynamics.
2. Diversity Impact on Firm Performance
One of the more aggressive claims emerging from organizations like the WEF is that diversity quotas have the added benefit of improving firm performance. Citing studies from major consulting companies McKinsey[15] and Boston Consulting Group (BCG),[16] the WEF says that the case for such policies is now “overwhelming.”[17]
To be clear, this conclusion has far reaching implications. It means not only that holding skill and past work experience constant, employers should choose more diverse candidates, but also that there will be situations where the improved firm performance from diversity is sufficient to overcome weaker performance the firm might have from hiring a candidate with less relevant experience or skills.
But is the research case for these conclusions about performance indeed “overwhelming”? In 2021 researchers from Texas A&M and the University of North Carolina at Chapel Hill studied S&P 500 firms using the methods employed by McKinsey in their three major studies on diversity and firm performance and found much different results. In their study, the relationship between executive diversity and a series of financial metrics[18] were all statistically insignificant. They concluded that “caution is warranted in relying on [McKinsey’s] findings to support the view that U.S. publicly traded firms can deliver improved financial performance if they increase the racial/ethnic diversity of their executives.”[19]
Another study from 2015 studying gender diversity and its impact on financial performance found similar results. The authors synthesized the findings from 140 studies looking at board gender diversity with a combined sample of more than 90,000 firms from more than 30 countries. The researchers found that the relationship between board gender diversity and company performance was effectively zero. Further, they find that there is no evidence that the addition or presence of women on the board causally changes company performance.[20]
Some academics have taken issue with this way of assessing firm success and have asserted that there are “non-financial” benefits to imposing diversity quotas. One study for example finds that while there are no statistically significant financial benefits associated with diversity in executive leadership, firms that have more diverse boards typically have higher “environmental, social, and governance” (ESG) ratings, suggesting they are more likely to provide broader societal benefits. However, relying on these ratings to accurately determine broader, less quantifiable societal benefits is limited at best. For example, Tesla Motors which famously popularized electrical vehicles received just a 37 out of 100 in the S&P 500’s 2022 ESG report, while cigarette giant Philip Morris received a score of 84 out of 100.[21],[22]
3. Can This Backfire?
A common counterargument to the arguments listed above is that while it may be true that there are no obvious empirical benefits associated with increasing diversity, there are benefits on a societal level in that increased representation encourages others from certain underrepresented demographics to aspire to more. Thus, who cares if standards are altered to achieve these outcomes?
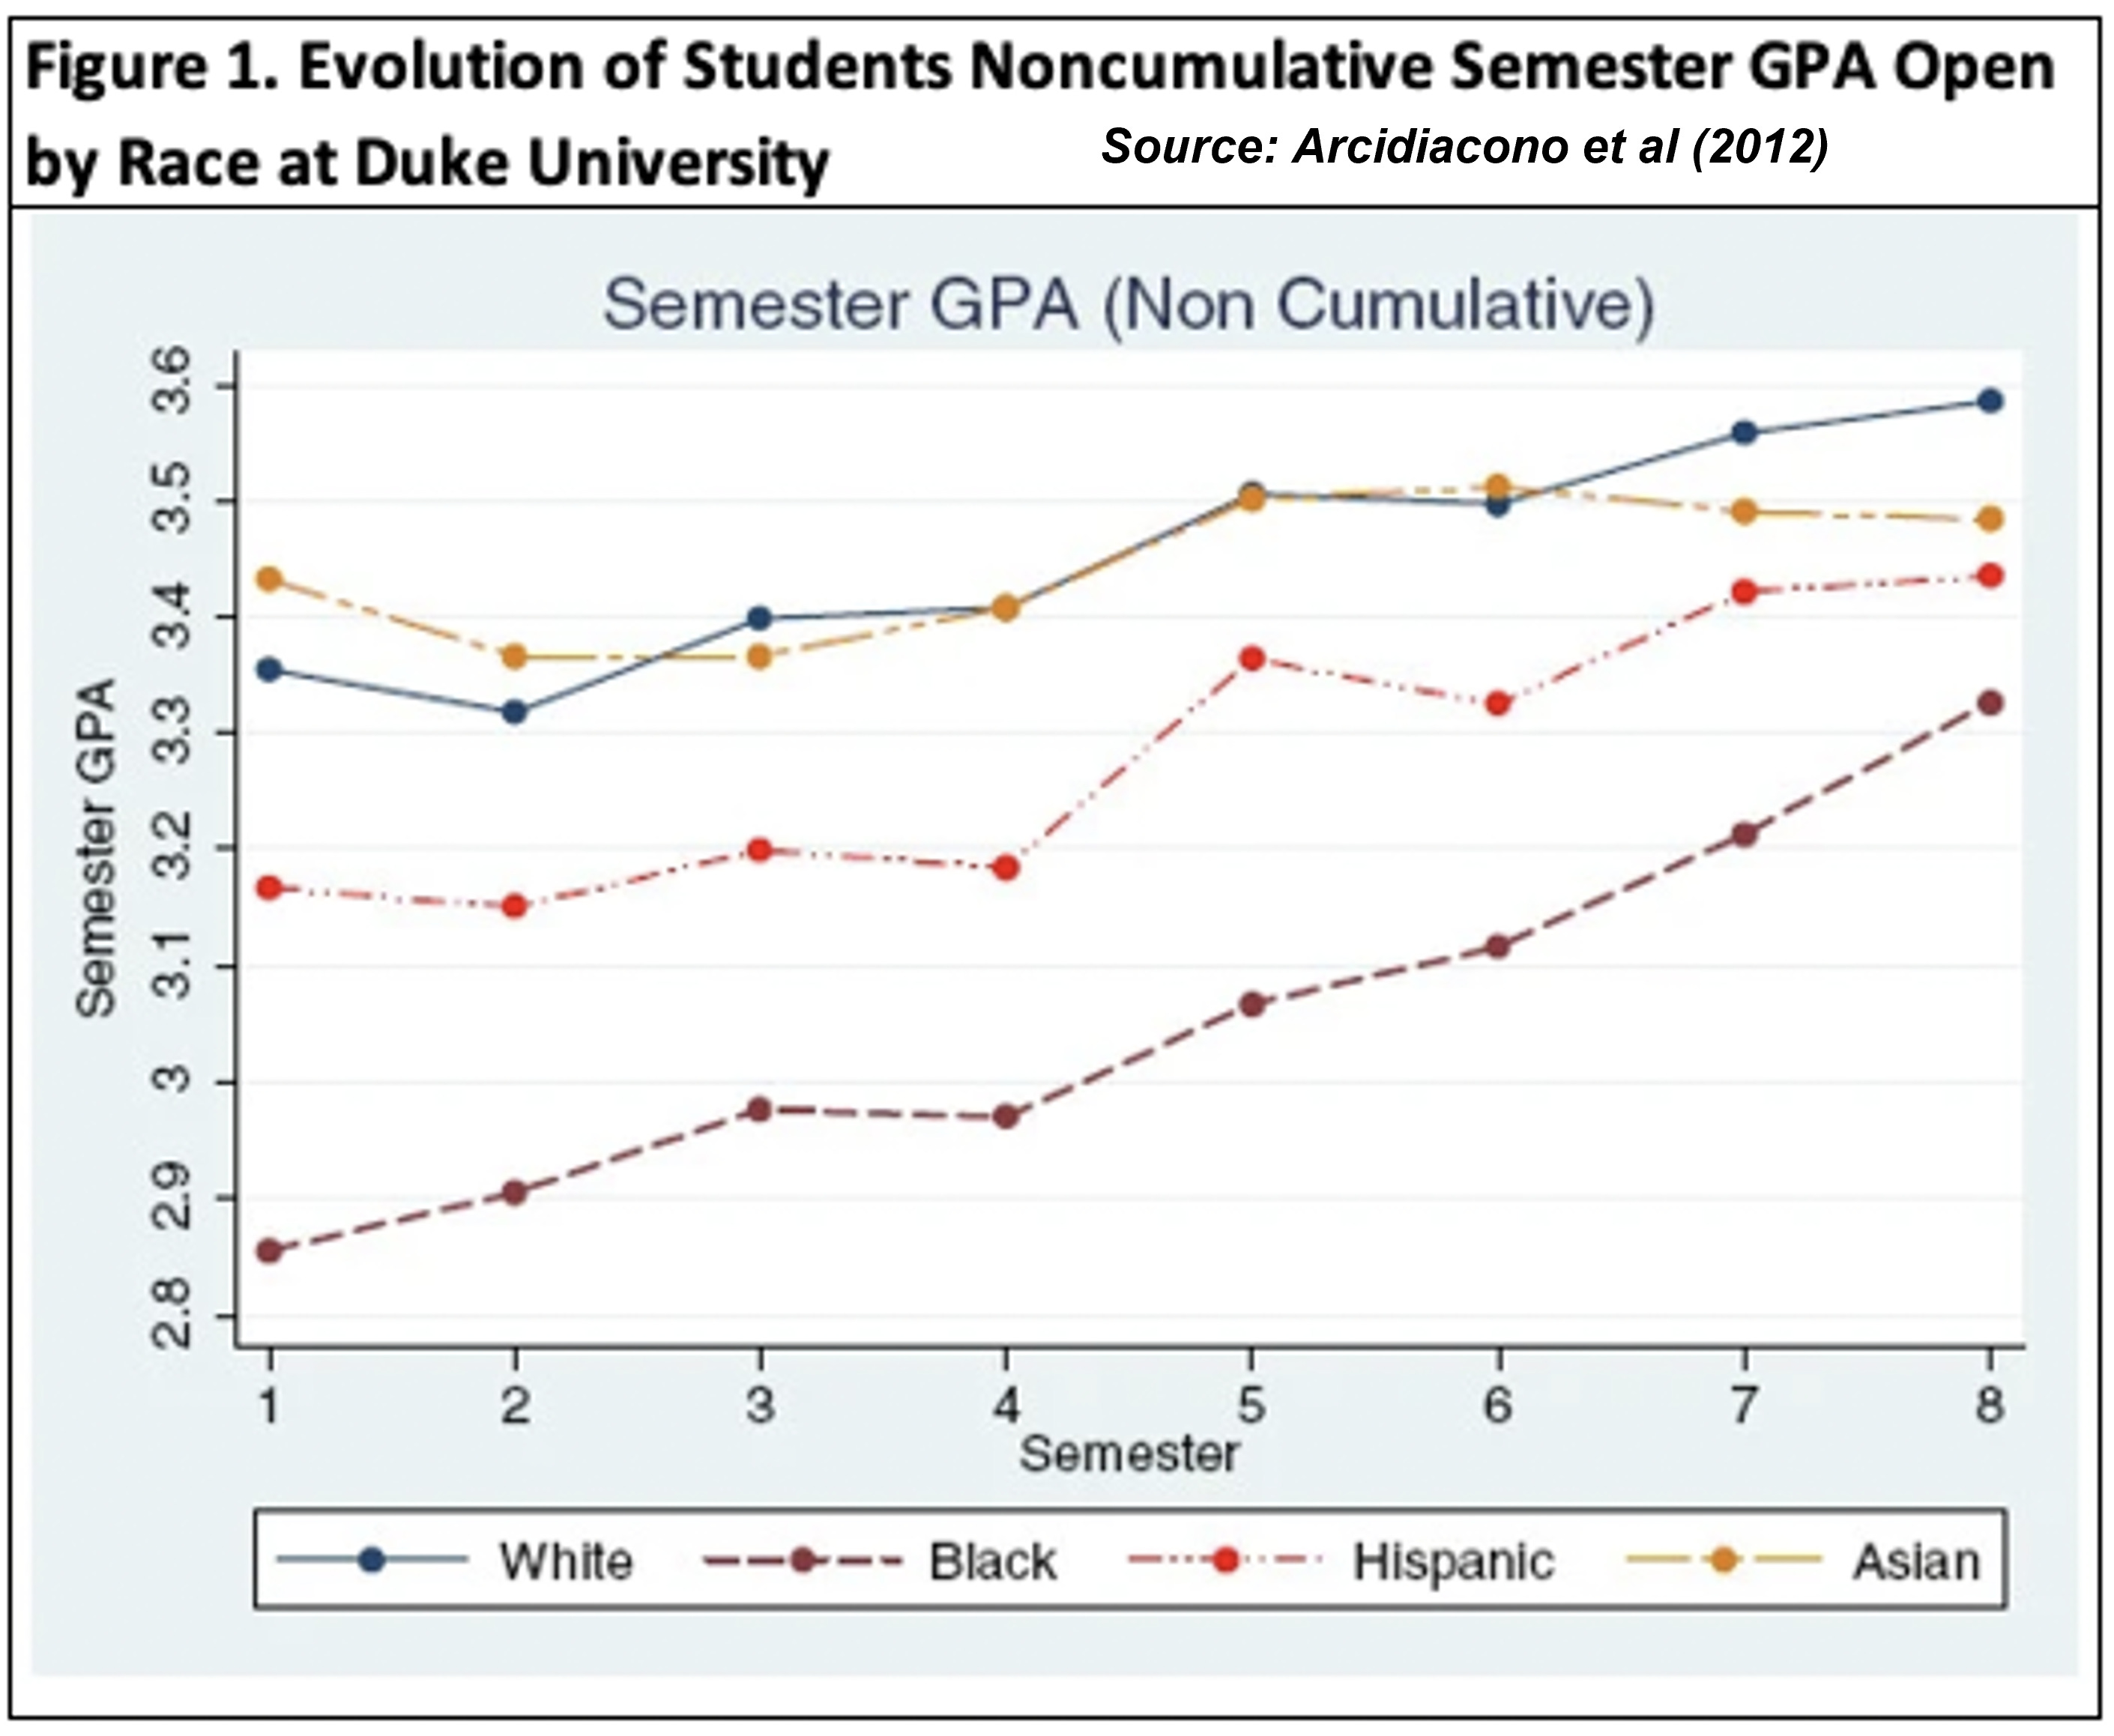
But this argument presupposes that there are no negative consequences for the targeted groups receiving preferential treatment. A famous 2012 study from Peter Arcidiacono, Esteban M. Aucejo and Ken Spenner at Duke University looked at student performances and major choices by racial categories over the course of students’ tenures at Duke.[23] The authors noted the differences in admission criteria across racial categories and wanted to know whether students who on average had lower scores relative to their classmates ultimately achieved similar performance to other students over the course of their tenures at school.
Initially, the evidence seemed to suggest this was the case. While white students and black students finished their freshmen years with average GPAs of 3.38 and 2.88, respectively, they ultimately completed their senior years with GPAs of 3.64 and 3.31, respectively. (See Figure 1 Below).
However, upon considering the concurrent changes to major choices, this “catch-up” effect becomes more dubious (See Table 1). While white and black students started in traditionally more demanding majors like natural sciences, engineering and economics at remarkably similar rates (60.8 percent and 61.7 percent, respectively), this changed dramatically by senior year. 50.5 percent of white students finished their senior years in these fields, while just 29.6 percent of black students finished in these same fields.
The authors argue that despite diversity advocates pouring billions of dollars into diversity efforts in STEM fields, their commitments to diversity quotas are ironically making it harder to reach higher proportions of minority representation in these fields. They explain: “minority students would be higher up in the preparation distribution at a less-selective school, potentially resulting in a higher probability of persisting in a science major.”[24] Beyond diversity concerns, these majors are also typically associated with higher incomes. According to the National Science Foundation, individuals earning STEM degrees have a median salary that is 47 percent greater than non-STEM workers.[25] Thus, in the name of improving diversity outcomes on campus, students who otherwise would have been perfectly competitive students at less-selective schools in more rigorous fields must accept lower lifetime salaries on average.
While this study from Duke is instructive, the worst impacts may not actually occur at schools like Duke, but rather at less selective schools that have to change admission criteria more aggressively to reach demographic quotas. Thomas Sowell, Senior Fellow at the Hoover Institution, makes this point in his 2004 book Affirmative Action Around the World. Using the University of Colorado at Denver and the University of Colorado at Boulder, he compares the gaps in SAT scores between white and black students and the corresponding graduation rates from each school. At the University of Colorado at Denver, the gap between black and white applicants’ SAT scores was just 30 points, and thus there was a negligible difference in graduation rates with 50 percent of black students and 48 percent of white students graduating within six years. However, at the University of Colorado at Boulder, there was a 200-point difference in SAT scores between white and black students. While 72 percent of white students graduated, just 39 percent of black students graduated.[26]
So, while much of the media attention is given to less selective schools on questions related to diversity quotas, having to choose different, less profitable majors while still a problem is not nearly as problematic as is forcing perfectly capable students to not graduate in service of reaching arbitrary representation statistics. Instead, students would be much better off being sorted in the same ways as their peers, as this would ensure greater opportunity for these students to compete and succeed in majors they went to college to study.
Conclusion
While racism and misogyny still exist in America, there are many factors other than discrimination that might explain both differential academic performance and differential representation in occupational fields, both of men versus women and across racial demographics. Even if historical injustices are to blame for present circumstances, demanding equality of outcomes immediately will not meaningfully change these discrepancies.
To the extent that representation differences are brought on by lack of access to resources and educational opportunities, greater focus should be placed on adopting methods and practices that have best ameliorated performance differences among the least privileged in society and the most privileged. Success Academy charter schools are one of the shining examples of schools that have been able to upskill and educate students coming from underprivileged backgrounds. For example, Success Academy Charter School-Harlem in 2020-2021 saw greater than 95 percent of its students achieving proficiency in math (state average is 55 percent) and reading and language arts (NY state average is 62 percent), ranking the school in the top 1 percent of all New York schools. Minority enrollment at the school is 98 percent and almost 70 percent of students are eligible for “free lunch”[27] (compared to the state average of 52 percent), which is determined by specific income thresholds.[28],[29]
While social engineering policies may make their proponents feel virtuous, they do not provide the longer-lasting benefits associated with properly training young people for the ever more complex challenges that await the newest generations in the workforce.
[1] https://environment.uw.edu/about/diversity-equity-inclusion/tools-and-additional-resources/glossary-dei-concepts/
[2] https://www.weforum.org/agenda/2023/05/women-board-directors-dei-profitability/
[3] https://www.weforum.org/centres/centre-for-the-new-economy-and-society/projects/partnering-for-racial-justice-in-business
[4] Veronika Dolar, “The Gender Gap in Economics is Huge – It’s Even Worse than Tech”, The Conversation, 12 March 2021, https://theconversation.com/the-gender- gap-in-economics-is-huge-its-even-worse-than-tech-156275.
[5] Garth Fowler et al. (2018), “Women Outnumber Men in Psychology Graduate Programs”, American Psychological Association, December 2018, https://www.apa.org/monitor/2018/12/datapoint#:~:text=Averaging%20across%20all%20doctoral%20programs,is%20some%20variability%20across%20subfields.
[6] https://www.apa.org/monitor/2018/12/datapoint
[7] Outside of cognitive psychology, women dominate men in terms of representation across all fields in both masters and doctorate programs. For example, in school, clinical, and counseling psychology PhD programs in particular, women constitute 85, 78, and 74 percent of the programs, respectively. In all other areas, men’s representation does not exceed 39 percent.
[8] Zippia, “Sanitation Worker: Demographics and Statistics in the US”, Zippia: The Career Expert, 2022, https://www.zippia.com/sanitation-worker-jobs/demographics/.
[9] National Center for Education Statistics, “The Condition of Education 2021: Characteristics of Public-School Teachers”, May 2021, https://nces.ed.gov/programs/coe/pdf/2021/clr_508c.pdf.
[10] https://pubmed.ncbi.nlm.nih.gov/29442575/
[11] Gisjsbert Stoet and David Geary (2018), “The Gender-Equality Paradox in Science, Technology, Engineering, and Mathematics Education”, Psychological Science 29, no. 4 (2018), https://www.researchgate.net/publication/323197652_The_Gender-Equality_Paradox_in_Science_Technology_Engineering_and_Mathematics_Education.
[12] https://freebeacon.com/latest-news/amazon-faces-suit-over-10k-offer-made-exclusively-to-black-latinx-and-native-american-entrepreneurs/
[13] https://freebeacon.com/campus/a-microsoft-fellowship-caps-the-number-of-white-and-asian-applicants-lawyers-say-thats-illegal/
[14] https://freebeacon.com/latest-news/how-business-giants-get-lower-interest-rates-for-meeting-diversity-quotas/
[15] https://www.mckinsey.com/capabilities/people-and-organizational-performance/our-insights/why-diversity-matters
[16] https://www.bcg.com/publications/2018/how-diverse-leadership-teams-boost-innovation
[17] https://www.weforum.org/agenda/2019/04/business-case-for-diversity-in-the-workplace/
[18] e.g., industry-adjusted EBIT margin, industry-adjusted sales growth, gross margin, return on assets, return on equity, and total shareholder return
[19] Jeremiah Green and John R. M. Hand, “Diversity Matters/Delivers/Wins Revisited in S&P 500 Firms”, SSRN.com, 24 May 2021, https://papers.ssrn.com/sol3/papers.cfm?abstract_id=3849562.
[20] https://www.jstor.org/stable/24758233
[21] https://freebeacon.com/latest-news/how-tobacco-companies-are-crushing-esg-ratings/
[22] https://papers.ssrn.com/sol3/papers.cfm?abstract_id=2531212
[23] https://izajole.springeropen.com/articles/10.1186/2193-8997-1-5
[24] Ibid., pg. 20.
[25] https://ncses.nsf.gov/pubs/nsb20212/figure/LBR-12#:~:text=STEM%20workers%20with%20a%20bachelor's%20degree%20or%20higher%20have%20a,workers%20without%20a%20bachelor's%20degree.&text=Share%20Median%20salaries%2C%20by%20workforce%20and%20education%20level%3A%202019.
[26] Sowell, Thomas. “Affirmative Action in the United States.” Affirmative Action Around the World: An Empirical Study. New Haven: Yale UP, 2004. 154-155. Print.
[27] https://www.publicschoolreview.com/success-academy-charter-school-harlem-1-profile#:~:text=What%20percent%20of%20students%20have,62%25%20NY%20state%20average).
[28] https://otda.ny.gov/workingfamilies/schoollunch.asp
[29] Those families qualifying for a “free lunch” are those with incomes up to 130 percent of the poverty line (e.g., $34,450 for a family of 4 annually).
 | A guest post by
|